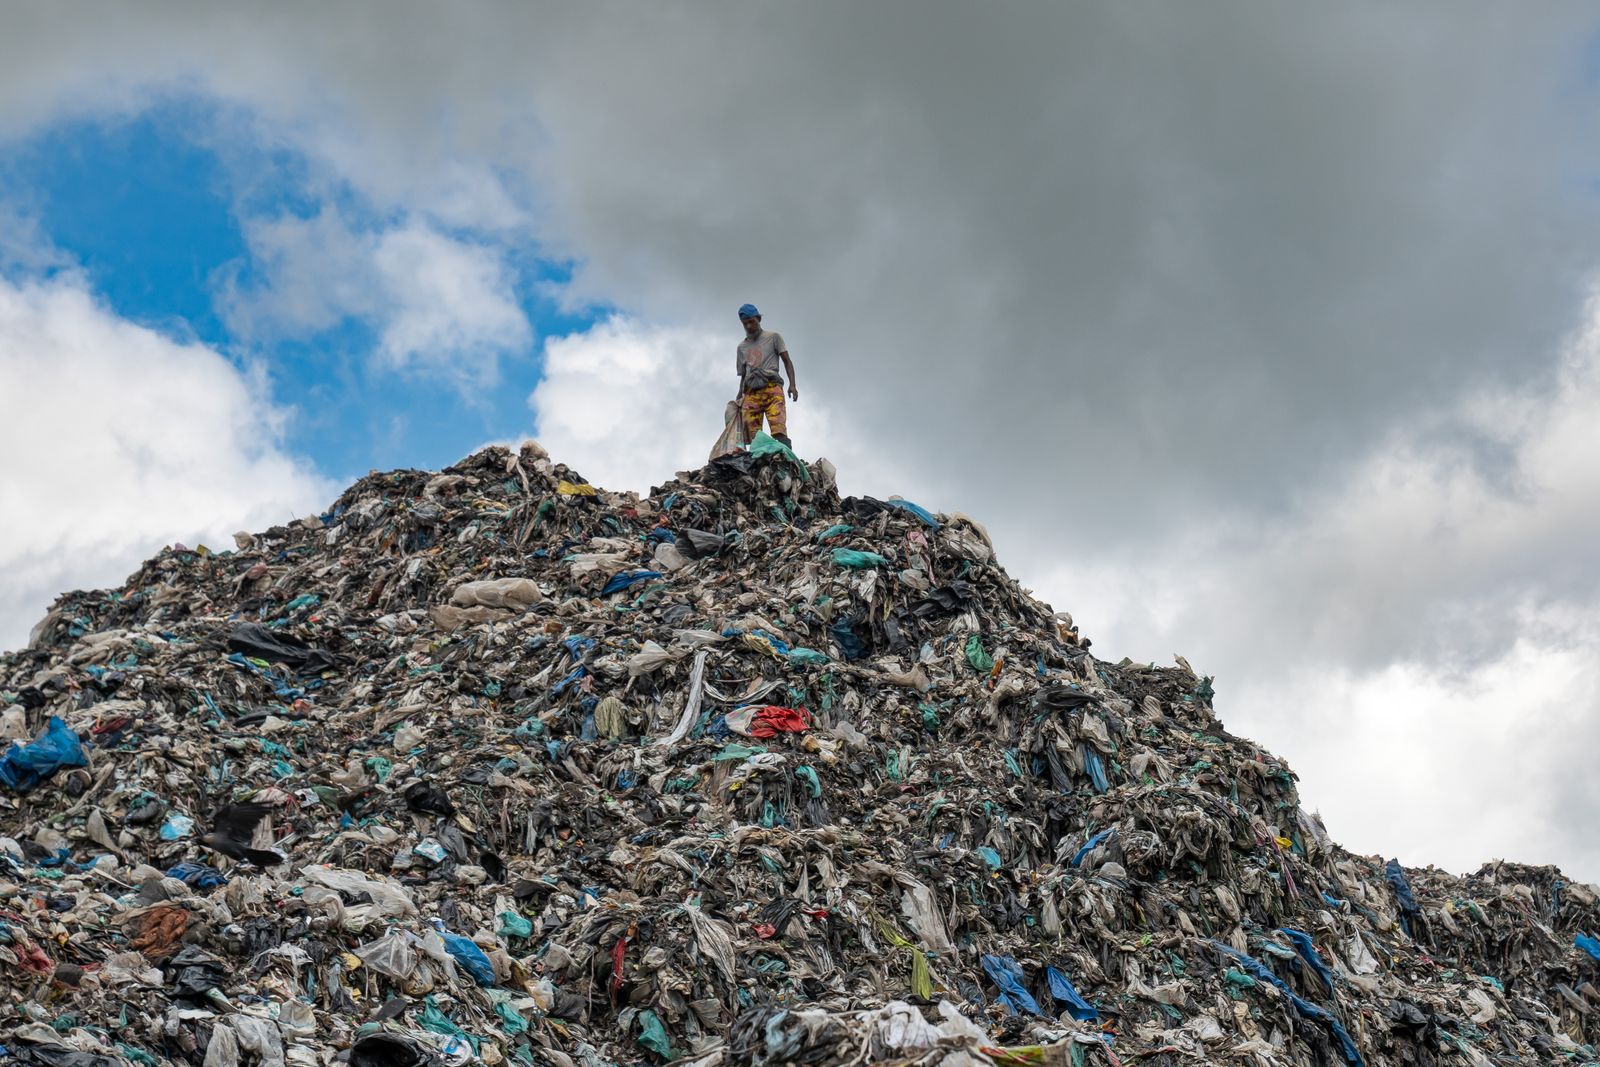
On a business-as-usual path, the world is projected to generate enough mismanaged plastic waste between 2010 and 2050 to cover Manhattan in a pile 10 times the height of the Empire State Building. The comparison comes from a 2024 study involving UC Santa Barbara industrial ecologist Roland Geyer and marine ecologist Douglas McCauley. Published in Science, the research examined how plastic production, waste management and policy choices could shape pollution through 2050.
The comparison is cumulative, not an estimate of the waste produced during a single year. It also concerns mismanaged plastic waste rather than every discarded plastic item. Those distinctions matter because the study separates material sent to formal landfills, incinerators and recycling systems from material that is not formally managed.
How the Manhattan-sized pile gets built
Plastic use is still rising under the study’s business-as-usual scenario. Annual global plastic consumption is projected to increase from 547 million metric tonnes in 2020 to 749 million tonnes in 2050. Annual plastic waste generation is projected to rise even faster, from 425 million tonnes to 687 million tonnes over the same period.
The researchers’ projected 2050 breakdown assigns approximately 271 million tonnes to landfill, 168 million tonnes to formal incineration, 127 million tonnes to recycling and 121 million tonnes to mismanagement. Landfill and formal incineration would therefore receive close to two-thirds of that year’s waste. Mismanaged waste would still almost double from its 2020 level of 62 million tonnes.
The paper defines waste as mismanaged when it is not formally landfilled, incinerated or recycled. Possible routes include littering, a lack of collection, open dumping and open burning, but the model does not calculate those routes separately. It therefore cannot establish what portion would be burned, shipped overseas or released into the ocean.
Why the familiar 9 percent figure is different
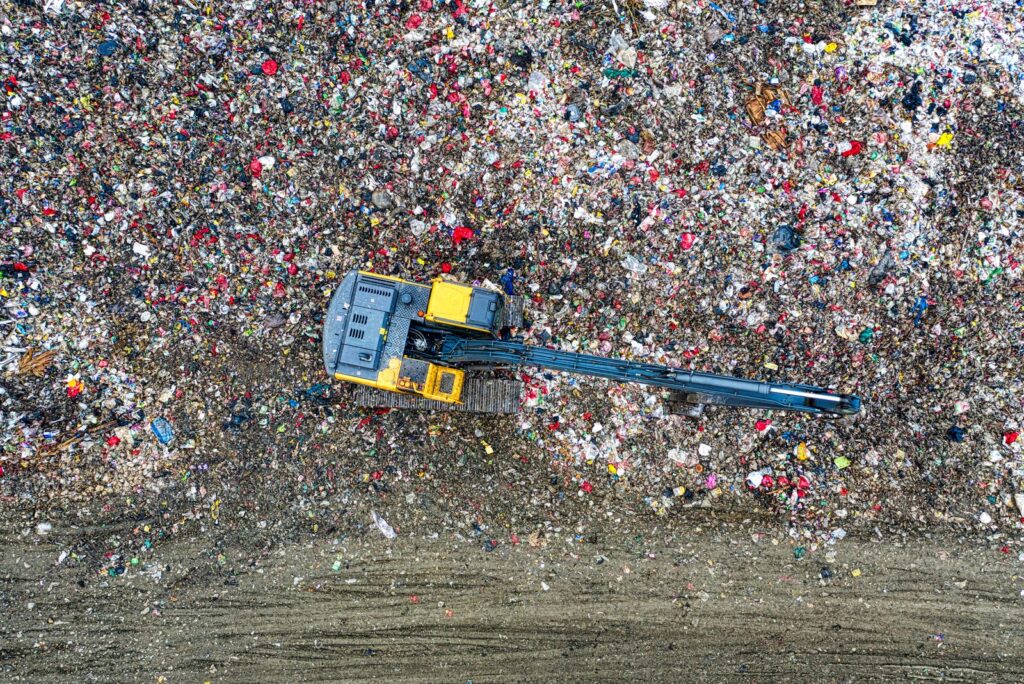
A separate study by Roland Geyer, Jenna Jambeck and Kara Lavender Law examined the cumulative production and disposal of plastics through 2015. A University of Georgia summary of that research reported that 9 percent of the plastic waste generated by then had been recycled, 12 percent had been incinerated and 79 percent had accumulated in landfills or the natural environment. That historical estimate is not the same measurement as the annual recycling share used in the 2024 projection.
In the newer model, the absolute amount recycled each year rises from roughly 95 million tonnes in 2020 to 127 million tonnes in 2050. Total waste generation grows more quickly, however, so recycling does not keep pace with the expanding stream. The two studies use different time frames, but both show why recycling alone cannot contain continued growth in plastic waste.
The burden is distributed unevenly
The 2024 study groups most countries outside China, North America and its defined European region under the term “Majority World.” It estimates that around 90 percent of mismanaged plastic waste occurs within that broad group. The finding points to unequal collection and waste-management capacity, but it does not mean that all of this material was produced elsewhere and exported there.
The pressure extends beyond plastics. The World Bank’s What a Waste 3.0 assessment reports that global municipal solid waste reached 2.56 billion tonnes in 2022 and could reach 3.86 billion tonnes by 2050 under business as usual. It also reports collection rates as low as 31 percent in sub-Saharan Africa and 67 percent in South Asia, although these figures cover all municipal waste rather than plastic alone.
An April 2026 Down To Earth analysis based on the World Bank data says waste volumes could grow by 124 percent in sub-Saharan Africa and 99 percent in South Asia by 2050. It also highlights the increasing share of low-value, multilayer plastic packaging that is difficult to recycle. The central problem is a widening gap between the amount discarded and the systems available to collect and manage it.
Formal incineration and open burning are not the same
Formal incineration takes place in controlled facilities and appears as its own category in the model. Open burning can occur at dumpsites, behind homes or in streets, and may fall within the broader category of mismanagement. Treating both practices as one destination obscures an important difference in how the study counts waste.
The World Health Organization’s July 2025 technical brief says open-waste burning releases pollutants that can harm both health and the climate. The mixture being burned can include plastics, paper, metals, household chemicals and organic waste. This supports concern about open burning, but it does not prove that burning is the fastest-growing destination for plastic worldwide.
The ocean holds part of the problem
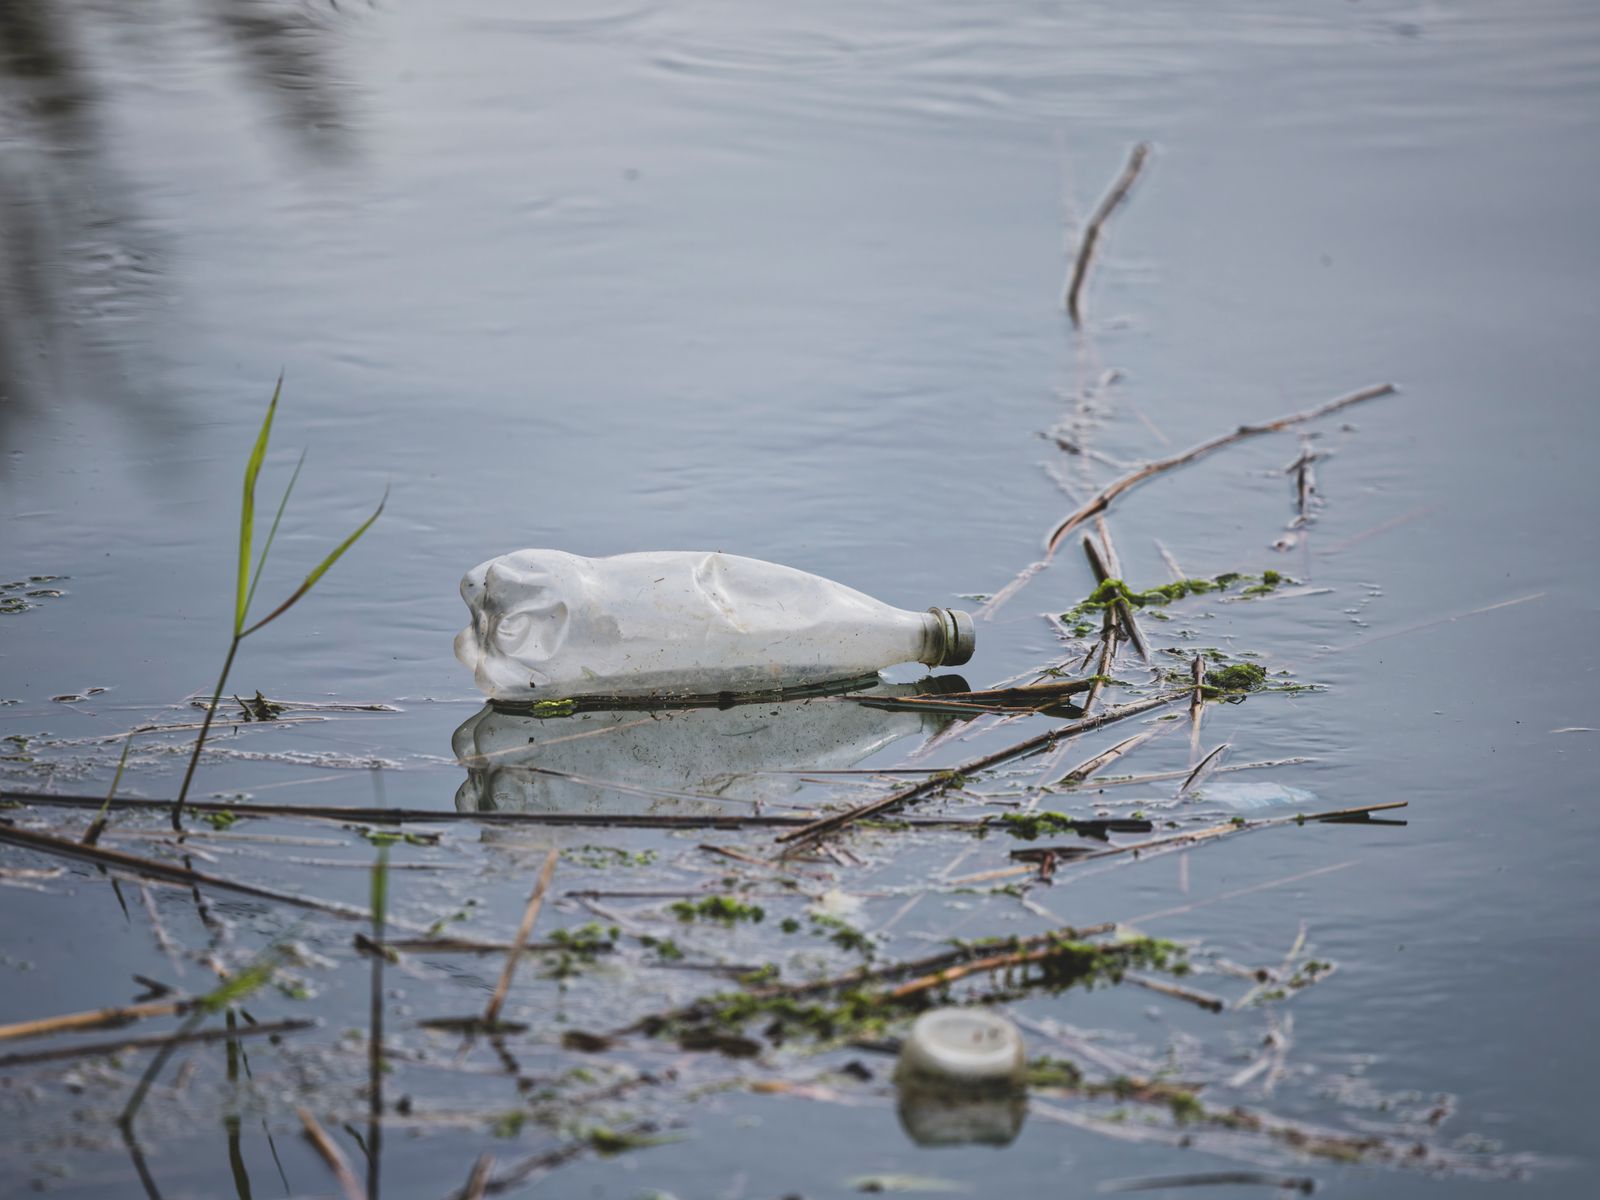
Some mismanaged plastic reaches rivers and seas, although neither the UCSB model nor the Manhattan comparison says that most of it enters the ocean. A 2018 study published in Scientific Reports estimated that at least 79,000 tonnes of plastic were floating within a 1.6-million-square-kilometre area identified as the Great Pacific Garbage Patch. More than three-quarters of its estimated mass consisted of debris larger than five centimetres, and at least 46 percent was made up of fishing nets.
Microplastics accounted for approximately 94 percent of the estimated number of pieces but only 8 percent of the mass. Older descriptions often compared the patch’s area with Texas, and a 2015 Mic explainer noted that this framing could mislead readers into imagining a solid island. The patch is instead a shifting concentration of debris spread through the water.
Why the Empire State Building comparison must remain a visualization
The Manhattan comparison comes directly from the researchers’ public explanation of their cumulative projection. It is not a measurement of a real heap, and it should not be reverse-engineered using one generic density for plastic. Discarded material includes films, rigid objects, fishing gear and fragments with very different shapes and levels of compaction.
The defensible comparison is therefore the one stated by the research team: enough cumulative mismanaged plastic waste to cover Manhattan to 10 times the height of the Empire State Building. A calculation producing one and a half times the building’s height conflicts with that source. The model’s underlying mass projections provide the firmer measure of how quickly the problem is growing.
What policy changes could accomplish
The researchers tested eight possible interventions across production, use and disposal. They found that four measures used together could reduce projected mismanaged plastic waste in 2050 by 91 percent and cut the plastic system’s projected greenhouse gas emissions by about one-third. The package included a 40 percent recycled-content requirement, a cap on virgin plastic production at 2020 levels, substantial investment in waste-management infrastructure and a charge on plastic packaging.
The recycled-content requirement produced the largest reduction in mismanaged waste when tested individually. In the model, it reduced the 2050 estimate from 121 million tonnes to 59 million tonnes. Production limits and waste-management investment address different parts of the system, which is why the combined package performs more strongly than recycling by itself.
The model does not predict that one policy will make plastic pollution disappear. It shows that coordinated measures can sharply change the trajectory while reducing emissions associated with plastic production and disposal. Without those measures, both total waste and the portion that escapes formal management continue to rise.
The treaty remains unfinished
The treaty process did not end in Busan in December 2024. Negotiations resumed in Geneva in August 2025, but INC-5.2 adjourned without consensus on a treaty text. The committee met again on February 7, 2026, for INC-5.3, which dealt with leadership and administrative matters rather than substantive negotiations.
As of September 2026, UNEP’s committee page lists preparations leading toward INC-5.4. No binding global plastics treaty has yet emerged from the process. Production limits, product design, waste infrastructure and financing remain central questions for the negotiations.
The Manhattan mountain will never stand as one physical heap. Its material would be scattered among controlled landfills, incinerators, recycling systems, dumpsites, waterways and countless smaller fragments. Its value as an image is that it makes a dispersed problem visible, but the image works only when its scale, time frame and waste categories are reported accurately.